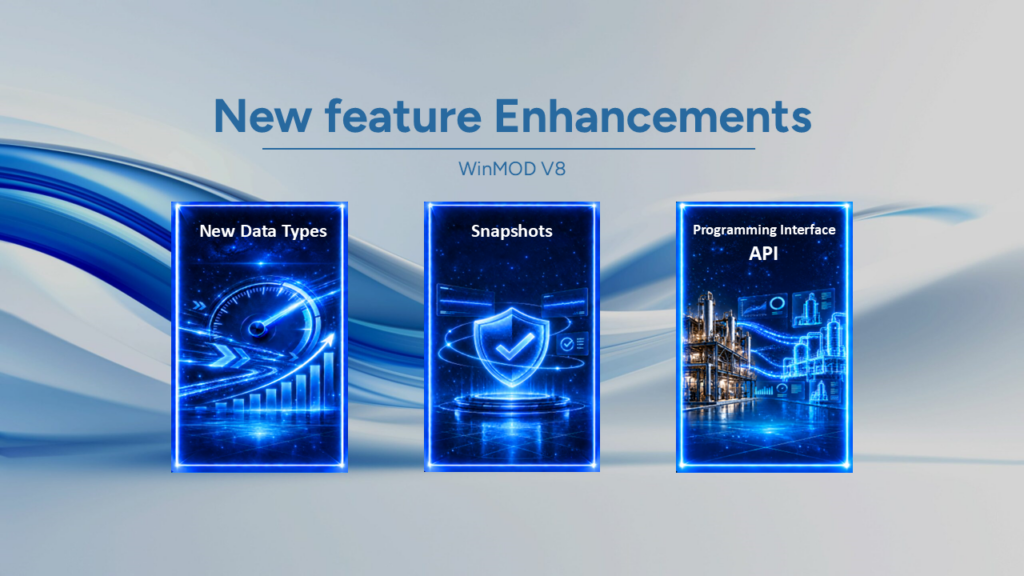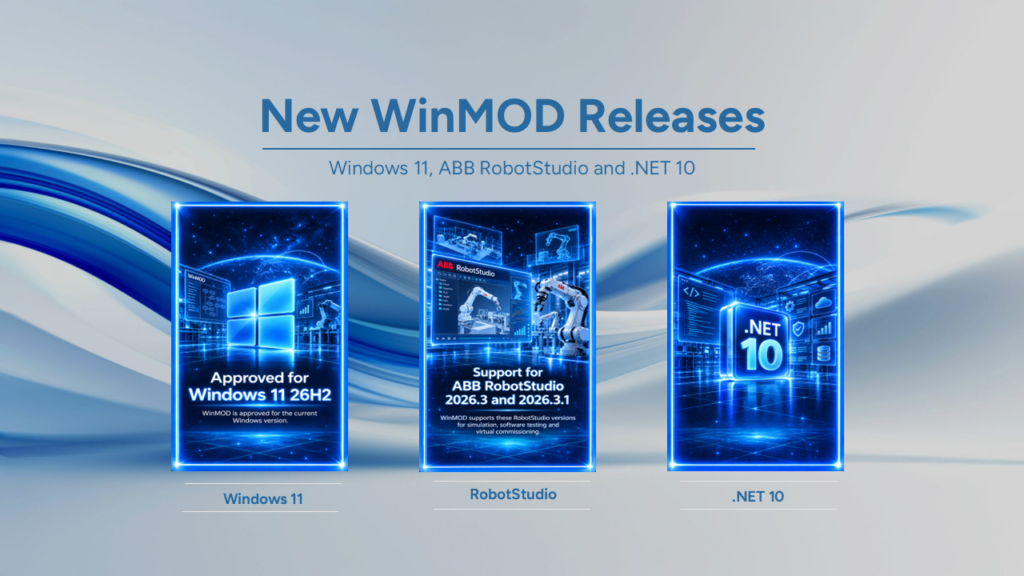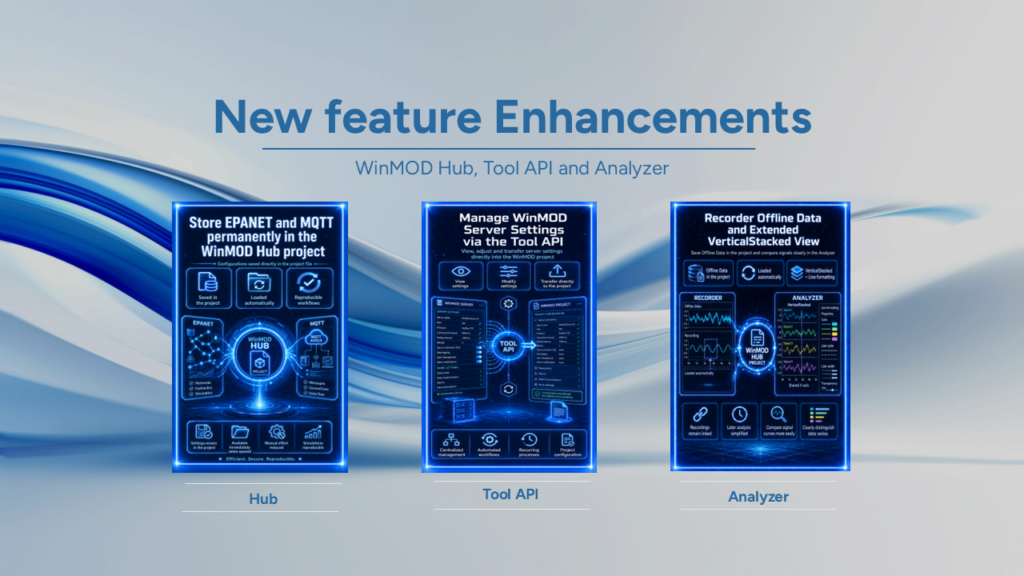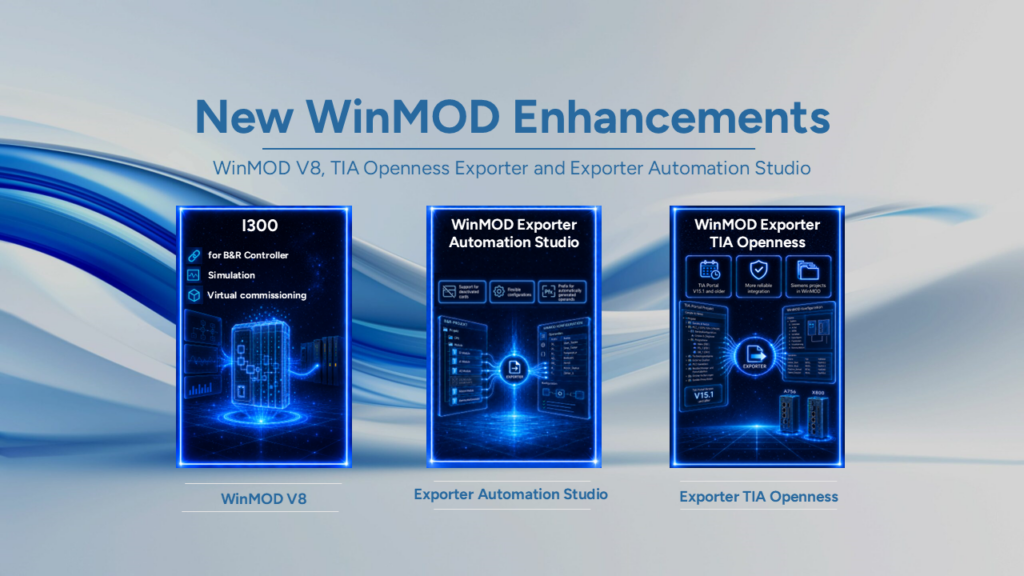
With the latest updates, users gain access to new features for WinMOD V8, the WinMOD Tool API as well as the Analyser, these innovations improve workflows in development, project management, simulation and signal analysis – particularly in the field of virtual commissioning and the digital twin.
The focus is, in particular, on an expanded range of functions for Structured Text in the Macro Editor, simpler error diagnosis in formula text, new possibilities for API-based tool development, and a clearer display of data series in the Analyzer.
Highlights:
- Extended functionality for Structured Text in the Macro Editor
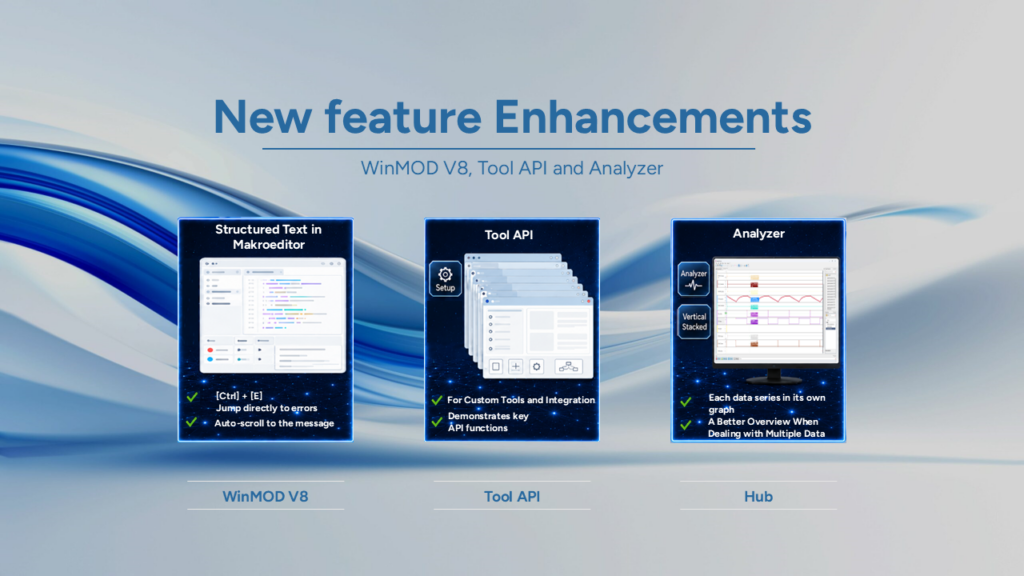
The range of functions available for Structured Text (ST) in the WinMOD V8 macro editor has been expanded. This allows macros to be created more flexibly and existing workflows to be mapped more conveniently. In addition, error analysis in formula text has been optimised: when errors occur, the lower window automatically scrolls to the relevant message. Via [Ctrl] + [E] Users are taken directly to the incorrect statement. This makes it easier to diagnose the problem and speeds up the correction of formulae and macro content.
- WinMOD Tool API now included in the WinMOD V8 setup
The WinMOD V8 Setup now includes the WinMOD Tool API. This demonstrates key functions of the WinMOD V8 API and helps developers create their own tools for integration with WinMOD V8. Selected developers can obtain the source code on request in order to implement customised extensions and integration solutions.
- New VerticalStacked view in the Analyser
The analyser offers VerticalStacked A new form of graph visualisation. VerticalStacked arranges multiple charts or Y-axes vertically, one above the other. This allows users to compare different data series in separate areas, but along a common X-axis. Each data series is given its own display area with its own information. This improves clarity, particularly when there are multiple values with different scales or units. At the same time, temporal relationships remain clearly recognisable, as the Analyser displays the data series synchronously along the same X-axis. Furthermore, the new display does not use gridlines. This gives the view a cleaner appearance and makes trends easier to identify.
If you have any questions about the new features, possible applications or WinMOD V8, our support team will be happy to assist you as usual.